The Starling curve is basically a graph of load versus performance for the heart.

the more you load the heart the harder it contracts and more work it does and it’s a good thing up to a certain point.
It allows us to cope with additional requirements in our lives, but again up to a certain point. At this point we tire and become less productive and need rest.
Pushing things further we fail, and when the heart fails things like heart attacks and heart failure happen.
And life’s a bit like that.

Take the rubber band you can stretch it quite a degree, no problems, but again like many systems too much and it breaks.
Once it breaks, well,it’s never the same

Like the heart and rubber bands we have to know the limits and detect our peak load before failure.
Work is like that, after a certain amount of work efficiency drops off, any further, big problems, these are called heart attacks, strokes, resignations, strikes and lawsuits.
And society is like that,here, these are called crime, assaults etc,demonstrations,tax avoidance and revolutions.
The purpose of leaders is to get people running efficiently,happily and to be productive and people intrinsically want to be productive, they want their efforts to produce results.
Take an 8 hour shift v lets say 12hrs.
To function in the longer shift the worker will have to pace himself, he may actually perform the exact same amount of work but slower.
I wonder why? this?
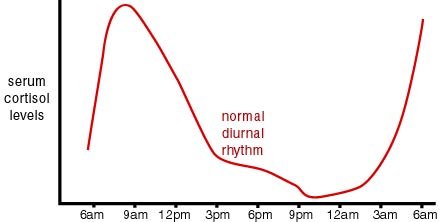
this is a graph of cortisol fluctuations
cortisol controls blood sugar levels
you need sugar to think
and 3pm is about siesta time in europe
so there you have it, over about 9hrs
with a 6am start after 3pm not very effective theoretically
hmm i wonder what time most errors occur?
